

EP-VISION
The 3 smart steps to improve energy efficiency
Evaluating your company’s energy performance is the first step towards efficient and intelligent consumption management. Knowing how and how much you consume allows the energy manager to plan the optimal investments to make your business really efficient. Each investment must then be exploited to the fullest in terms of monitoring and actions to improve performance.
The 3 smart steps to improve energy efficiency are:
1. Energy audit: starting from real data
2. Implementation of efficiency actions: creating tailor-made solutions for each company
3. Electricity consumption monitoring: assess the benefits and leverage the data to further improve
Electricity consumption monitoring
The monitoring phase of electricity consumption is the heart of the energy efficiency project. Only by collecting energy performance data can the validity of an efficiency project be evaluated. By comparing the preliminary energy diagnosis data with those collected during the work of e-Power it is possible to measure the performance improvement.
How do I access consumption monitoring data?
Thanks to the EP-Vision interface.
The Vision interface is complete, reliable and intuitive and allows the individual customer to check the performance of their system while EP-X is in operation.
The monitoring of electricity consumption allows not only to evaluate the performance of EP-X in terms of better efficiency but also to identify the margin for improvement to obtain performance that improves over time.
EP-Vision: what it does and what data it shows
What does EP-Vision do?
The EP-Vision interface allows you to:
- Immediately verify the performance of the e-Power system, both in terms of energy and environmental efficiency, both in absolute values and in graphs
- Receive automatic periodic updates on all data and establish an effective interactive channel with Energia Europa
- Monitor all the main electrical quantities on the line managed by e-Power retrieved with high frequency sampling and download the data of interest in the selected time intervals
Which data does EP-Vision show?
EP-Vision provides two groups of useful data: data on the efficiency of the electrical system and data on external benefits.
Plant performance data is divided into 3 categories and shows the convenience of EP-X for the company:
1. the percentage of efficiency (percentage of saving)
2. the amount of kWh saved (energy efficiency)
3. the energy savings achieved (economic benefit)
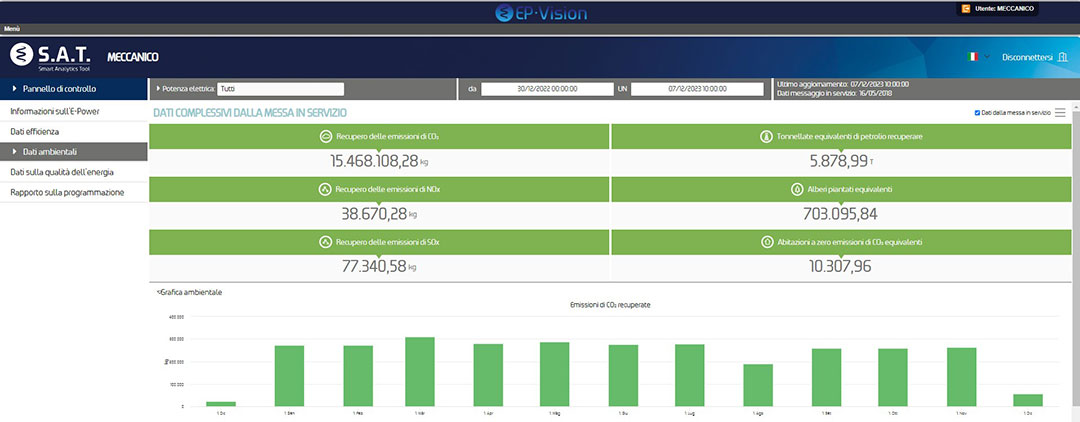
The data on external benefits are also divided into 3 categories and show the benefits that a company brings to the external environment:
1. recovered CO2 emissions: each kWh not consumed allows to recover about 0.430 kg of CO2 emissions
1. recovered forest: every 22 kg of CO2 recovered corresponds to the work of an apple tree in a year
1. recovered homes: we translate the CO2 recovered into emissions of an average home
Let’s see how the monitoring of electricity consumption before and after the installation of e-Power can provide useful data to evaluate the economic and environmental benefits in a precise and accurate way, also giving information on the tangible benefits of energy efficiency that are very useful for corporate communication and for the dissemination of its benefits in a market increasingly oriented to sustainable choices in every sector.
EP-Vision
Video Tutorial
At tris link io can vie the video tutorial chat guide io through the use of the interface